


| Source: Date: Updated: |
Chart of the Day
Thursday, March 28, 2013 Thursday, March 28, 2013 |
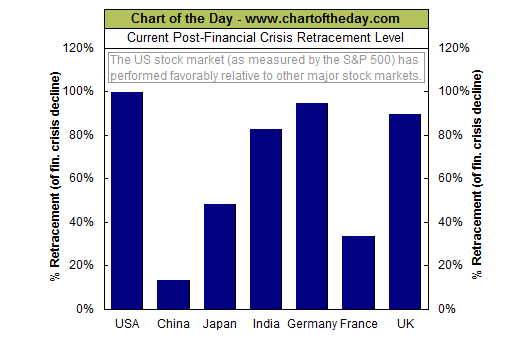
For some perspective on the post-financial crisis rally, today’s chart illustrates how much of the downturn that occurred as a result of the financial crisis has been retraced by several major international stock market indices. For example, the S&P 500 peaked at 1,565.15 back in October 9, 2007 and troughed at 676.53 back on March 9, 2009. The most recent close for the S&P 500 is 1,563.77 — it has retraced 99.8% of its financial crisis bear market decline. As today’s chart illustrates, China (Shanghai Composite), Japan (Nikkei 225), India (S&P BSE Sensex), Germany (DAX), France (CAC 40) and the UK (FTSE 100) are all above their financial crisis lows (i.e. above 0% on today’s chart) while none of the aforementioned countries are currently trading above their respective pre-financial crisis peak (i.e. none are above 100% on today’s chart). It is interesting to note that the US (epicenter of the financial crisis) has outperformed the other major stock market indices while China has lagged.
Source: Chart of the Day

