


| Source: Date: Updated: |
Chart of the Day
Wednesday, December 12, 2012 Wednesday, December 12, 2012 |
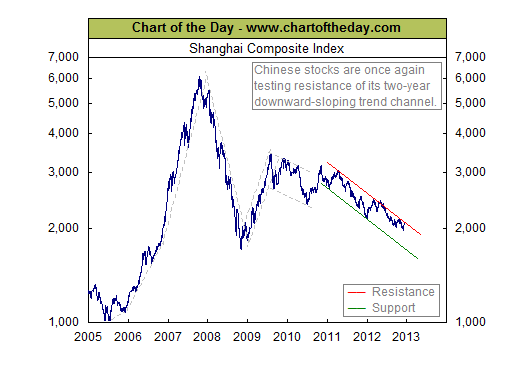
Today’s chart illustrates the overall trend of the increasingly important Chinese stock market as measured by the Shanghai Composite Index. Today’s chart illustrates how the Chinese stock market went parabolic from mid-2005 until late 2007. China’s boom was immediately followed by a financial crisis induced bust with the Shanghai Composite Index plunging 72% in a little more than one year. Unlike what occurred stateside, China’s post-financial crisis rally was relatively short-lived (only nine months). Over the past two years, the Shanghai Composite Index has traded within the confines of a relatively steep downward sloping trend channel. Over the past week, the Shanghai Composite has worked its way higher as Chinese stock market investors anticipate the introduction/extension of stimulative government policies after this week’s Central Economic Work Conference. This recent rally, has brought Chinese stock prices right back up to resistance (red line).
This is an excerpt from Chart of the Day as it appeared on December 12, 2012. For updates or to read the current version of this post in its entirety, please click here.
Continue reading this post >

