


| Source: Date: Updated: |
Chart of the Day
Thursday, April 10, 2014 Thursday, April 10, 2014 |
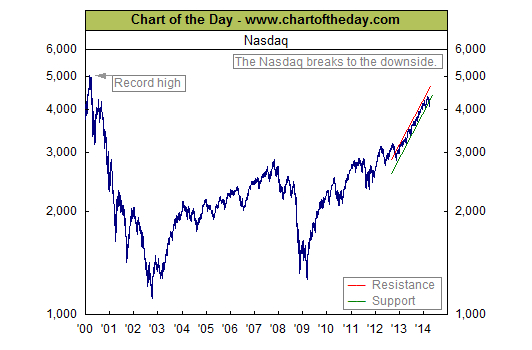
Tech stocks have corrected significantly over the past month. As a result the tech-laden Nasdaq is currently down over 5% from its March 5th peak. For some perspective, today’s chart illustrates the overall trend of the stock market (as measured by the Nasdaq Composite) since 2000. As today’s chart illustrates, the post-financial crisis rally (which began in early 2009) has been significant enough to have the Nasdaq surpass its credit bubble highs of late 2007. As today’s chart illustrates, however, the Nasdaq has just broken below support of its 17-month uptrend channel.
Source: Chart of the Day.

