


| Source: Date: Updated: |
Chart of the Day
Friday, November 9, 2012 Friday, November 9, 2012 |
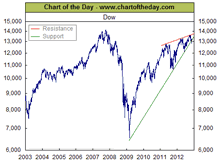 As a result of a host of concerns (looming fiscal cliff, European debt crisis, slowing Chinese economy, geopolitical issues, etc.), the Dow has pulled back from its post-financial crisis high of one month ago. For some perspective, today’s chart illustrates the overall trend of the stock market (as measured by the Dow) since 2003. As today’s chart illustrates, the post-financial crisis rally was especially sharp during its first two years. Since then, the rally slowed but continued to trade above support (green line) — until now.
This is an excerpt from Chart of the Day as it appeared on November 9, 2012. For updates or to read the current version of this post in its entirety, please click here.
Continue reading this post >

